How Do You Use KPIs to Source the Best Industrial-Grade Garden Valves?
You choose valves based on price, but they fail constantly. These cheap parts cause frustrating leaks and downtime, disrupting your entire production floor.
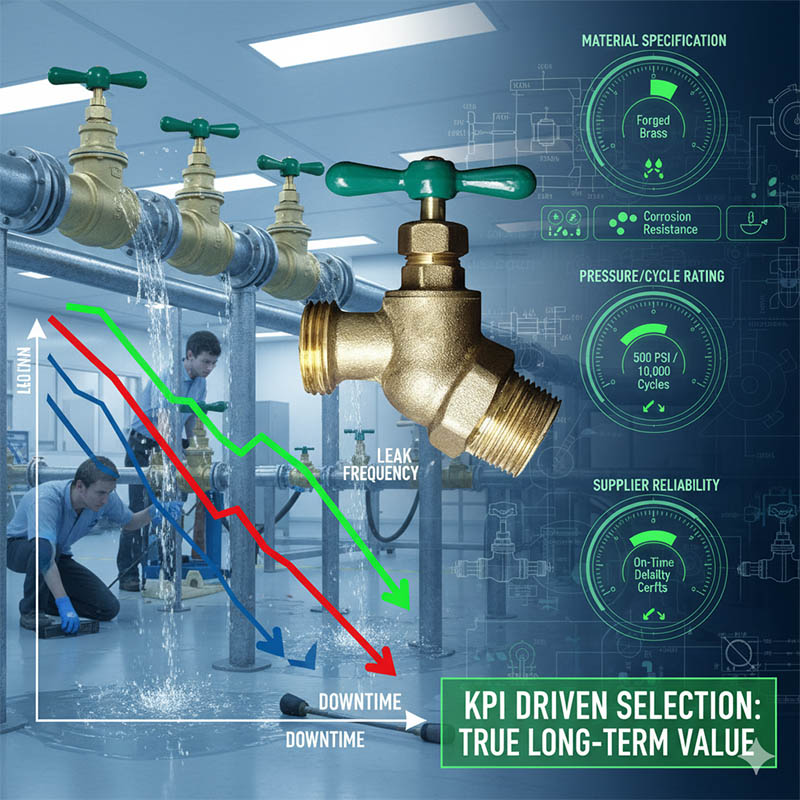
Use Key Performance Metrics (KPIs) to evaluate valves scientifically. Focus on material specifications, pressure/cycle ratings, and supplier reliability data. This data-driven approach moves beyond price to identify true long-term value and prevent failures before they happen.
Jacky, you've hit on a topic that most people ignore until it causes a big problem. I learned this the hard way when we opened a new extension on our factory. We needed dozens of water hookups for our mold temperature controllers. The facilities manager went to a big-box hardware store and bought a crate of the cheapest brass valves he could find. We spent the first month chasing constant drips and dealing with handles that seized up after being used twice. It was a huge waste of time. That experience taught me that even a "simple" valve is a critical industrial component. You have to evaluate it with data, not just a price tag.
How Can You Measure a Valve's Durability Beyond Its Price Tag?
Your sourced valves look fine when they arrive, but they start leaking or seizing within months. You're left dealing with frequent maintenance calls and don't have the data to explain why they're failing.
Evaluate a valve's true durability using its material specs and life cycle rating. The body material (forged vs. cast), stem and ball material (stainless steel vs. plated), and a certified cycle rating are your key performance indicators.
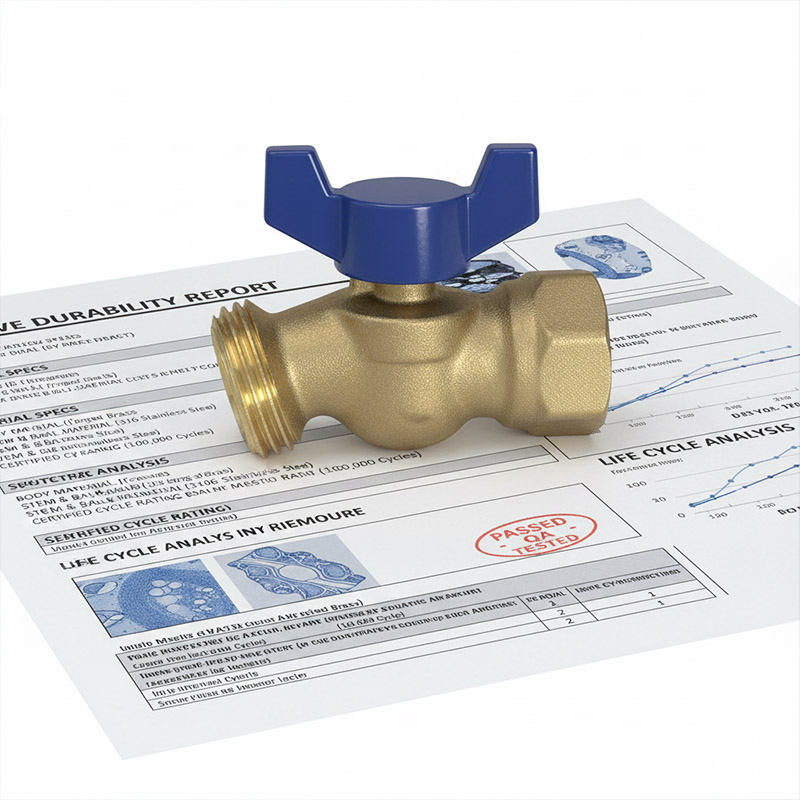
As a designer, you live in the world of material science. Apply that same thinking here. A cheap valve is often made from "cast" brass, which can have hidden porosity and impurities, making it brittle. A high-quality valve uses "forged" brass, which is denser and much stronger. The inside is even more important. A cheap valve might have a chrome-plated steel ball and stem. That plating can wear off, leading to rust and seizing. A better valve uses solid 304 or 316 stainless steel for these parts, giving it excellent corrosion resistance. The ultimate KPI here is a "cycle life" rating. Some manufacturers test their valves for 10,000 or more cycles and certify it. That number is a hard piece of data you can use to justify a higher initial cost.
Durability KPI: Material Scorecard
| Component | Low-Quality Indicator | High-Quality KPI | Why It Matters |
|---|---|---|---|
| Valve Body | Cast Brass | Forged Brass | Forging creates a stronger, denser, leak-resistant body. |
| Ball & Stem | Chrome-Plated Steel | Solid 304/316 Stainless Steel | Resists corrosion, prevents seizing, lasts longer. |
| Handle | Plated Steel with Vinyl Grip | Stainless Steel with Vinyl Grip | Prevents the handle itself from rusting and failing. |
| Life Cycle | No Rating Given | Certified for 10,000+ Cycles | Verifiable proof of mechanical endurance. |
What Performance Metrics Matter for Sealing and Flow Control?
You install a new valve, but it either has a slow, persistent drip or it restricts flow. This affects the efficiency of your mold cooling lines or other critical equipment.
Focus on two key performance metrics: the seat material and the port design. PTFE seats provide a vastly superior seal over a wider temperature range, while a "full port" design ensures zero flow restriction.
The seal, or "seat," that the ball closes against is a huge point of failure. The cheapest valves use simple rubber (NBR) O-rings. They work for a while, but they can degrade with chemicals, harden with age, or fail in high temperatures. The industrial standard is PTFE (Teflon). PTFE seats are chemically inert, resist high temperatures, and create an incredibly reliable seal. The other critical KPI is the port size. A "standard port" valve has a hole through the ball that is smaller than the pipe's inner diameter. This creates a bottleneck that can reduce flow by 30% or more. For a mold cooling circuit where flow rate is everything, this is unacceptable. A "full port" valve has an opening the same size as the pipe, so it adds no restriction. Specifying "full port" is a simple data point that guarantees performance.
Performance KPI: Ideal Valve Specification
| Feature | KPI Target | Performance Impact |
|---|---|---|
| Port Design | Full Port (or Full Bore) | No flow restriction; maintains system pressure. |
| Seat Material | PTFE (Polytetrafluoroethylene) | Excellent chemical/heat resistance, leak-proof seal. |
| Stem Seal | Blowout-Proof Stem with Dual Seals | Major safety feature; prevents stem ejection under pressure. |
| Pressure Rating | 600 WOG (Water, Oil, Gas) minimum | Ensures it can handle high industrial pressures. |
How Do You Quantify Supplier Reliability as a Key KPI?
You found the perfect valve on paper, but your supplier ships late or sends the wrong parts. This unreliability throws your project timelines into chaos and makes you look bad.
Track your supplier's performance with concrete metrics. The most important KPIs are On-Time Delivery (OTD) rate, Order Accuracy Rate, and Defect Rate. This data moves your evaluation from "feeling" to fact.

Jacky, your job isn't just to design things; it's to get them built. That means sourcing, and supplier performance is a huge part of that. A cheap part from an unreliable supplier is a very expensive problem. You need to start keeping a simple "supplier scorecard." It's easy. For every purchase order, track two things: Was it delivered on the promised date? That gives you your On-Time Delivery rate. Did you get exactly what you ordered in the right quantities? That's your Order Accuracy Rate. Over a few orders, a pattern will emerge. A supplier with a 99% OTD and 100% Accuracy is far more valuable than a slightly cheaper one who is late 20% of the time. This data is your ammunition to justify sticking with a good supplier, or for firing a bad one. It's not personal; it's just business based on performance.
Supplier Scorecard Example
| KPI | Supplier A (Cheap) | Supplier B (Reliable) | Calculation |
|---|---|---|---|
| On-Time Delivery | 82% | 99% | (On-Time Orders / Total Orders) x 100 |
| Order Accuracy | 95% | 100% | (Accurate Orders / Total Orders) x 100 |
| Defect Rate | 2% (20,000 PPM) | 0.1% (1,000 PPM) | (Defective Units / Total Units) x 1,000,000 |
| Sourcing Decision | High Risk | Low Risk, Strategic Partner | Data clearly shows Supplier B provides more value. |
Conclusion
Sourcing with data is a powerful tool. By using KPIs for product specifications and supplier performance, you turn purchasing into a strategic advantage that ensures reliability and long-term value.